 |
| Source: NodeXL Graph Gallery |
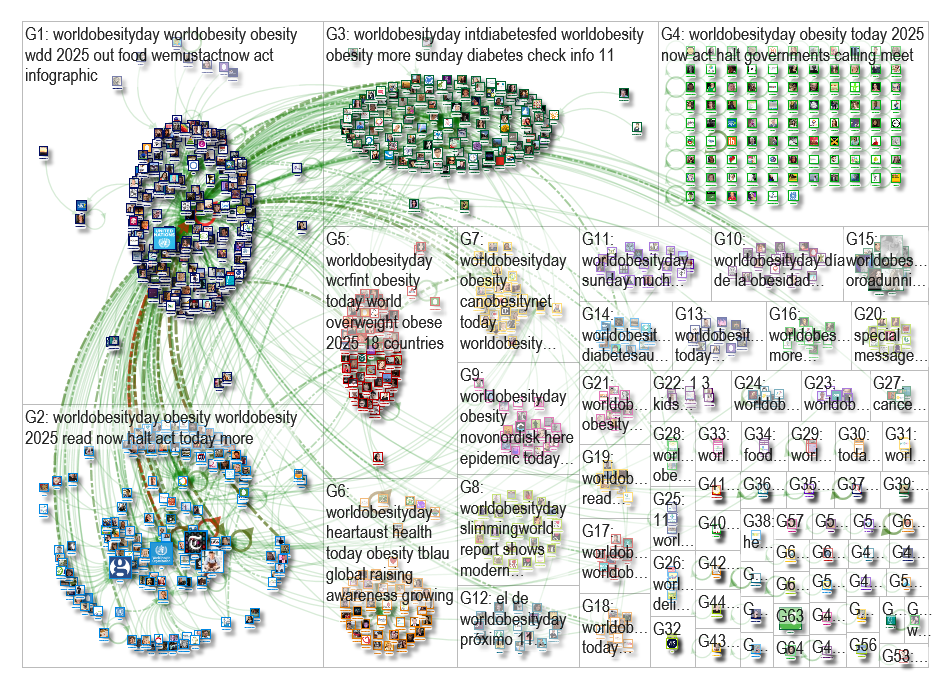
My first reaction to this data graphic is that the information represented in the graphic looks very clustered, confusing, and hard to decipher. However, the confusing nature of the graphic is just a reflection of how complex and interconnected networks can be. A normal social media user will not realize how similar he/she is to other users around the world in terms of the content that they post. The interface that a user interacts with on social media sites does not allow him/her to see the complexity.
It is only through data analysis tools such as NodeXL, and actually mapping out the connections between people's social network activities, that a person can actually see how often a particular topic is discussed or how popular an issue is. The graph is also a reflection of how interconnected the world is becoming, through the use of social media.
Despite the confusing layout of the graphic, a lot of useful information has been extracted from the graphic and grouped into various categories, such as "Top Hashtags" which are #worldobesityday and #obesity), "Top Replied To", which is the World Obesity Federation, and "Top Influencers" which is also the World Obesity Federation.
It is also important to note the prevalence of edges, compared to self-loops, in the graph. The edges are the green links between nodes in the graph, and represent any "replies to" or "mentions" relationship between tweets. The self-loops however, start from and end at the same node. This demonstrates the interactivity of people on twitter, whose tweets relate, in some way, to "World Obesity Day" and emphasizes the significance of social networks in today's age.
This graphic demonstrates the importance of data analysis software and its ability to depict the complexity of social networks which have become such a significant part of people's lives. Many people use social media regularly, but do not actually see the connections in social networks. Now, people can see these connections thanks to data analysis software, like NodeXL.
No comments:
Post a Comment